开始
在日常工作中遇到这样的任务
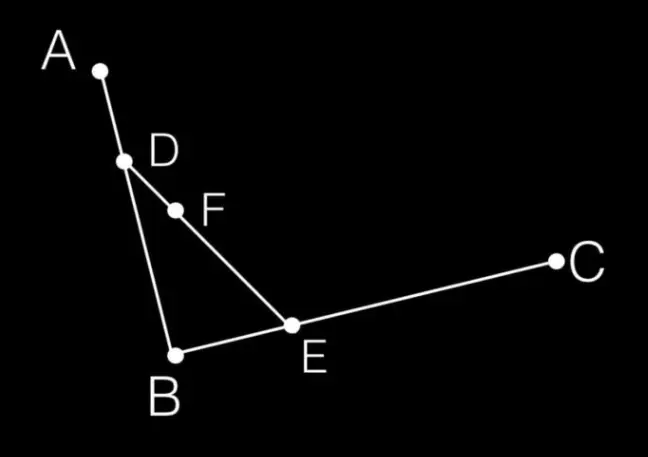
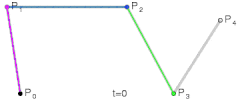
通过svg可以相对比较方便的把路径画出来,参考代码
<!-- 通过viewBox做适配 -->
<svg version="1.1" xmlns="http://www.w3.org/2000/svg" xmlns:xlink="http://www.w3.org/1999/xlink" width="7.5rem"
           height="6.35rem" id="map" viewBox="0,0,750,635">
           <line x1="318" y1="148" x2="478" y2="178" style="stroke:#ffffff;stroke-width:3"></line>
           <line x1="478" y1="178" x2="581" y2="264" style="stroke:#ffffff;stroke-width:3"></line>
           <line x1="581" y1="264" x2="690" y2="376" style="stroke:#ffffff;stroke-width:3"></line>
           <line x1="690" y1="376" x2="590" y2="485" style="stroke:#ffffff;stroke-width:3"></line>
           <line x1="590" y1="485" x2="447" y2="581" style="stroke:#ffffff;stroke-width:3"></line>
           <line x1="447" y1="581" x2="260" y2="518" style="stroke:#ffffff;stroke-width:3"></line>
           <line x1="260" y1="518" x2="94" y2="429" style="stroke:#ffffff;stroke-width:3"></line>
           <line x1="94" y1="429" x2="63" y2="313" style="stroke:#ffffff;stroke-width:3"></line>
           <line x1="63" y1="313" x2="127" y2="197" style="stroke:#ffffff;stroke-width:3"></line>
           <line x1="127" y1="197" x2="191" y2="206" style="stroke:#ffffff;stroke-width:3"></line>
           <line x1="191" y1="206" x2="318" y2="148" style="stroke:#ffffff;stroke-width:3"></line>
           <circle cx="318" cy="148" r="10" fill="#ffffff" stroke="#fff" stroke-width="1"></circle>
           <circle cx="478" cy="178" r="10" fill="#ffffff" stroke="#fff" stroke-width="1"></circle>
           <circle cx="581" cy="264" r="10" fill="#ffffff" stroke="#fff" stroke-width="1"></circle>
           <circle cx="690" cy="376" r="10" fill="#ffffff" stroke="#fff" stroke-width="1"></circle>
           <circle cx="590" cy="485" r="10" fill="#ffffff" stroke="#fff" stroke-width="1"></circle>
           <circle cx="447" cy="581" r="10" fill="#ffffff" stroke="#fff" stroke-width="1"></circle>
           <circle cx="260" cy="518" r="10" fill="#ffffff" stroke="#fff" stroke-width="1"></circle>
           <circle cx="94" cy="429" r="10" fill="#ffffff" stroke="#fff" stroke-width="1"></circle>
           <circle cx="63" cy="313" r="10" fill="#ffffff" stroke="#fff" stroke-width="1"></circle>
           <circle cx="127" cy="197" r="10" fill="#ffffff" stroke="#fff" stroke-width="1"></circle>
</svg>
因为只讲svg相关的,精简一些其他元素
Transition
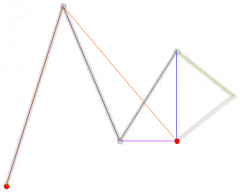
这边想让它按照路径线路运动起来,我一开始通过js设置运动元素的top和left,效果用transition来实现,参考代码
      //收集点坐标
      var pointArr = [{ x: "3.18rem", y: "1.48rem" },
      { x: "4.78rem", y: "1.78rem", next: true },
      { x: "5.81rem", y: "2.64rem", next: true },
      { x: "6.90rem", y: "3.76rem", next: true },
      { x: "5.90rem", y: "4.85rem", next: true },
      { x: "4.47rem", y: "5.81rem" },
      { x: "2.60rem", y: "5.18rem", next: true },
      { x: "0.94rem", y: "4.29rem", next: true },
      { x: "0.63rem", y: "3.13rem", next: true },
      { x: "1.27rem", y: "1.97rem", next: true },
      { x: "1.91rem", y: "2.06rem", next: true },
          // { x: "3.18rem", y: "1.48rem"}
      ];
      //移动方法,参数一为需要移动的选择器,参数二为移动点,参数3是移动时间
      function moveNext(selector,points,duration){
          var el = $(selector);
          if(!el.length){
              throw new Error("selector: '"+selector+"' no find!")
          };
          if(!points.length)return;
          if(!points.index&&points.index!=0){
              points.index =0;
          }
          points.index = ++points.index%points.length
          var p = points[points.index]
          el.css("pointer-events","none");
          el.css("transition","all linear "+duration+"ms")
          el.css("left", p.x).css("top", p.y);
          setTimeout(function(){
              el.css("pointer-events","initial");
              el.css("transition","none")
              if(p.next){
                  moveNext(selector,pointArr,duration)
              }
          }, duration);
      }
      //绑定点击事件
      $(".mapbox .imgbox").click(function () {
          moveNext(".mapbox .imgbox",pointArr,600);
      })
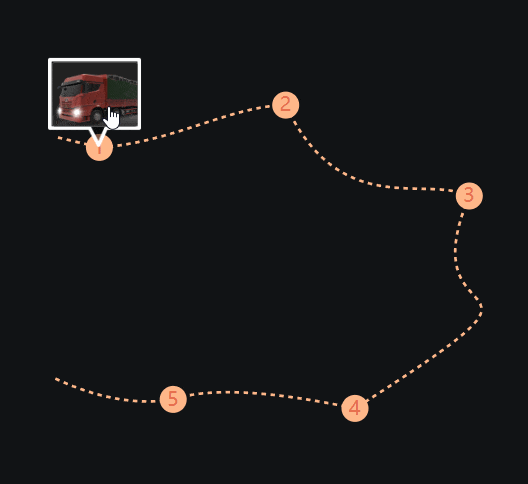
得到的效果如图
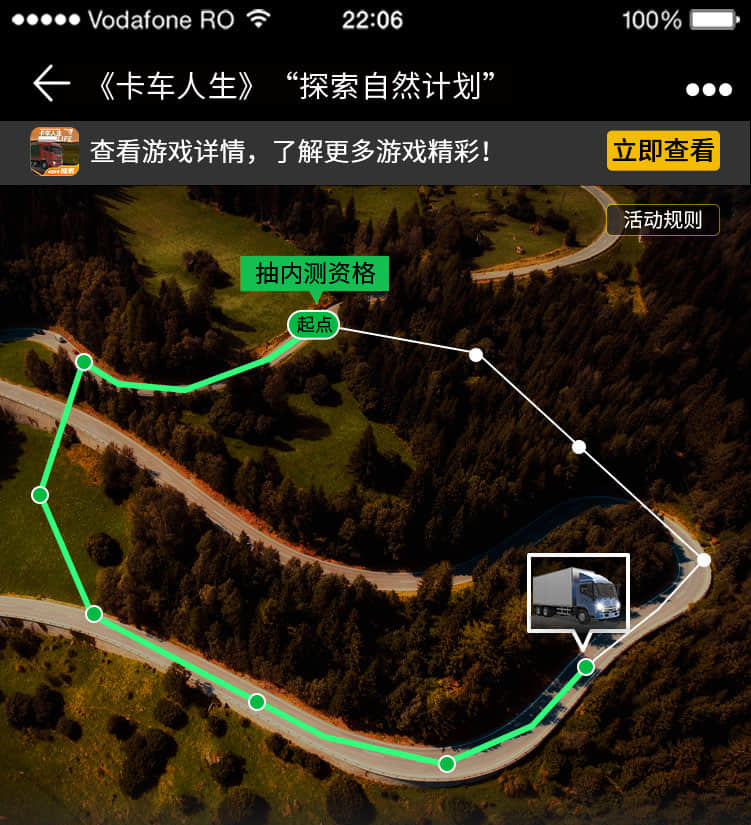
做到这边就想到之前做过的另一个路径图
Path命令
它这边的是曲线路径,当时简单切图,现在要能沿路径运动的话,需要改造一番,刚才直线很好画,参数也好理解,两点成线,现在用svg画曲线,第一个先了解path ,我们可以用path画出复杂的图形,当然也包括曲线,它包含下面的命令
- M = moveto
- L = lineto
- H = horizontal lineto
- V = vertical lineto
- C = curveto
- S = smooth curveto
- Q = quadratic Bézier curve
- T = smooth quadratic Bézier curveto
- A = elliptical Arc
- Z = closepath
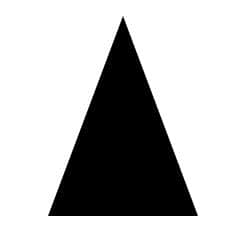
比如
<svg xmlns="http://www.w3.org/2000/svg" version="1.1">
    <path d="M150 0 L75 200 L225 200 Z" />
</svg>
可以画出一个三角形
画曲线主要用到
- C = curveto
- S = smooth curveto
- Q = quadratic Bézier curve
- T = smooth quadratic Bézier curveto
这几个命令,C是三阶贝塞尔曲线,Q是二阶贝塞尔曲线,如果贝塞尔曲线不了解的话,这边介绍一下
贝塞尔曲线(Bézier curve)
介绍
组成:由起点、终点、控制点组成。
说明:其中控制点的个数可以是0-n, 0个控制点的时候为一阶贝塞尔曲线(一条直线),1个控制点的时候为二阶贝塞尔曲线,以此类推。
重要性:是计算机图形学中相当重要的参数曲线。
前身:伯恩斯坦多项式,德卡斯特里奥算法
由来:由法国工程师(数学家)皮埃尔·贝塞尔(Pierre Bézier)所广泛发表,他运用贝塞尔曲线来为汽车的主体进行设计。
出发点:只需要很少的控制点,就可以绘制出一条平滑复杂的曲线。
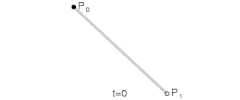
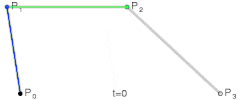
数学知识(二阶贝塞尔曲线为例)
步骤一:在平面内选3个不同线的点并且依次用线段连接
步骤二:在AB和BC线段上找出点D和点E,使得 AD/AB = BE/BC
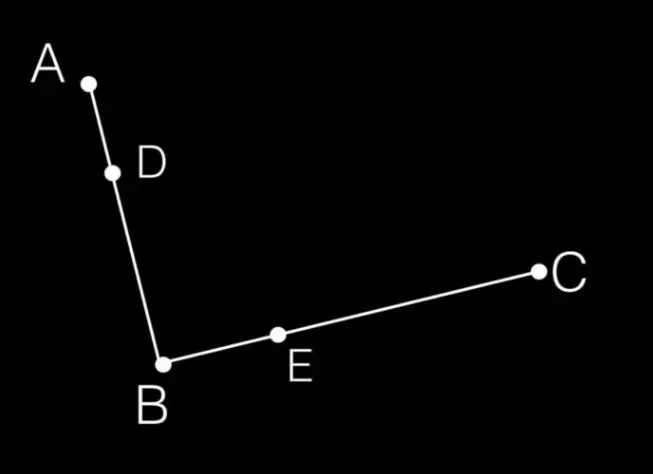
步骤三:连接DE,在DE上寻找点F,F点需要满足:DF/DE = AD/AB = BE/BC
步骤四:DF/DE = AD/AB = BE/BC = t
当 t 从 0-1 变化时,逆推出的所有 F 点连接起来,就绘制出了一条曲线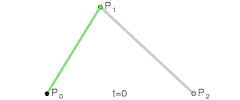
公式推导
P点为已知点,B点为最终所求的点(上面图所示的F点)。
一阶贝塞尔:B(t) = P0(1-t) + p1t
二阶贝塞尔:B(t) = P0(1-t)² + 2P1t(1-t) + P2t²
三阶贝塞尔:B(t) = P0(1-t)³ + 3P1t(1-t)² + 3P2t²(1-t) + P3t³
n阶贝塞尔

曲线绘制过程
- 一阶贝塞尔曲线
- 二阶贝塞尔曲线
- 三阶贝塞尔曲线
- 四阶贝塞尔曲线
- 高阶贝塞尔曲线
如果只是用path画曲线的话,那我们了解到这边就可以了
path画曲线
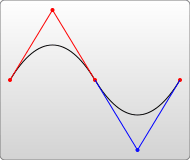
通过前面知识我们知道,path中的C命令是三阶需要4个坐标,即开始和结束坐标以及两个控制坐标,Q命令是二阶需要3个坐标,开始结束一个控制坐标点,S命令:当一个点某一侧的控制点是它另外一侧的控制点的对称(以保持斜率不变),可使用S命令。简写的贝塞尔曲线命令。如下图
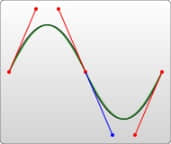
T命令:是Q命令的简写命令。与S命令类似,T也会经过前一个控制点,推断出一个新的控制点。(T命令前面必须是一个Q命令,或者是另外一个T命令,才能达到这种效果。若是T单独使用,那么控制点就会被认为和终点是同一个点,因此画出来的将是一条直线。)如下图
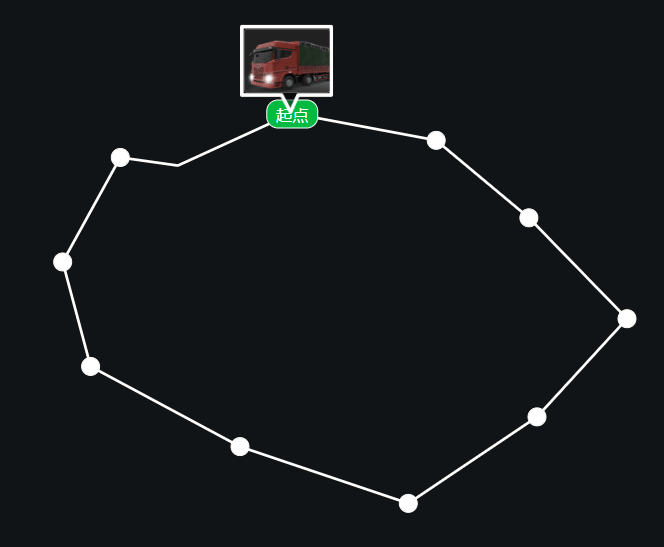
学习完基础知识,我们按照设计稿将曲线画出,大概是这样
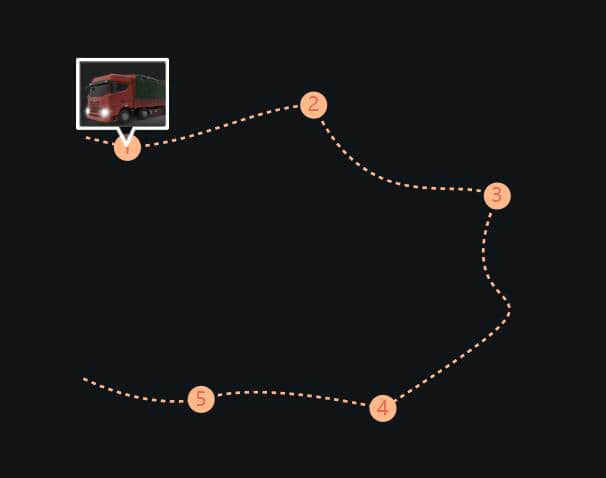
参考代码
        <svg version="1.1" xmlns="http://www.w3.org/2000/svg" xmlns:xlink="http://www.w3.org/1999/xlink" width="7.5rem"
            height="5.8rem" id="map" viewBox="0,0,750,580">
            <path d="M80,255T126,266" stroke="#ffb88a" fill="none" stroke-dasharray="5" stroke-width="3" />
            <path d="M126,266C207,261 271,220 333,219" stroke="#ffb88a" fill="none" stroke-dasharray="5"
                stroke-width="3" />
            <path d="M333,219C394,348 488,296 537,320" stroke="#ffb88a" fill="none" stroke-dasharray="5"
                stroke-width="3" />
            <path d="M537,320C465,490 680,384 410,556" stroke="#ffb88a" fill="none" stroke-dasharray="5"
                stroke-width="3" />
            <path d="M410,556Q267,526 208,546" stroke="#ffb88a" fill="none" stroke-dasharray="5" stroke-width="3" />
            <path d="M208,546Q147,556 75,522" stroke="#ffb88a" fill="none" stroke-dasharray="5" stroke-width="3" />
            <circle cx="126" cy="266" r="15" fill="#ffb88a" />
            <text x="126" y="266 " fill="#e76f4e" font-size="22">1</text>
            <circle cx="333" cy="219" r="15" fill="#ffb88a" />
            <text x="333" y="219 " fill="#e76f4e" font-size="22">2</text>
            <circle cx="537" cy="320" r="15" fill="#ffb88a" />
            <text x="537" y="320 " fill="#e76f4e" font-size="22">3</text>
            <circle cx="410" cy="556" r="15" fill="#ffb88a" />
            <text x="410" y="556 " fill="#e76f4e" font-size="22">4</text>
            <circle cx="208" cy="546" r="15" fill="#ffb88a" />
            <text x="208" y="546 " fill="#e76f4e" font-size="22">5</text>
        </svg>
运动小车是绝对定位和svg中点坐标一致
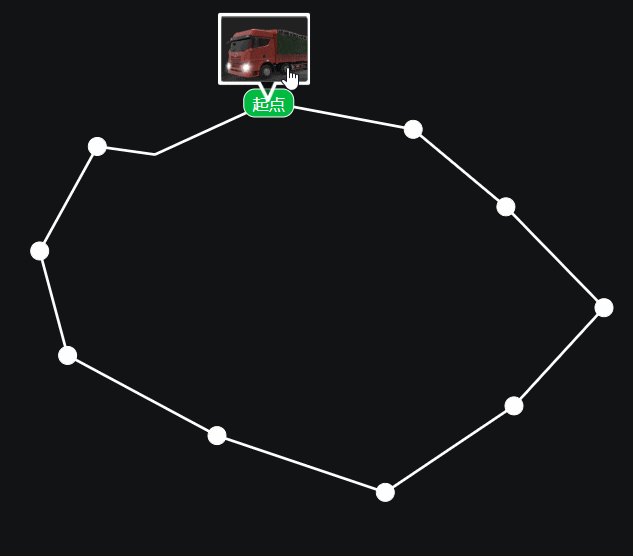
曲线运动
接下来要让小车动起来,原先的js写法是不行了,我们要用到svg的DOM接口,主要有
getTotalLength()获取path的总长度getPointAtLength()根据长度获取线上的点
这样我们就可以递增长度获取运动点,让元素沿曲线运动起来,参考代码
上面用function moveNext(selector, paths) { var el = $(selector); if (!el.length) { throw new Error("selector: '" + selector + "' no find!"); } if (!paths.length) return; if (!paths.current && paths.current != 0) { paths.current = 0; } var p = paths[paths.current]; paths.current = ++paths.current % paths.length; var step = 0; var move = function () { step += 0.03; if (step >= 1) { if (p.next) { moveNext(selector, paths); } else { el.css("pointer-events", "initial"); } return; } var nextpoint = p.getPointAtLength(step * p.getTotalLength()); el.css("pointer-events", "none"); el.css({ left: (nextpoint.x / 100).toFixed(2) + "rem", top: (nextpoint.y / 100).toFixed(2) + "rem", }); //DOM帧回调 requestAnimationFrame(move); }; requestAnimationFrame(move); }requestAnimationFrame优化了setTimeout,requestAnimationFrame相比setTimeout、setInterval优势有requestAnimationFrame会把每一帧中的所有DOM操作集中起来,在一次重绘或回流中就完成,并且重绘或回流的时间间隔紧紧跟随浏览器的刷新频率,一般来说,这个频率为每秒60帧。- 在隐藏或不可见的元素中,
requestAnimationFrame将不会进行重绘或回流,这当然就意味着更少的的cpu,gpu和内存使用量
最终效果